Marketing: Don’t settle for Fluffy!
In today’s digital age all your marketing should have a tangible impact on the bottom line

POSTED ON: Monday, July 31st, 2017
CATEGORIES: Marketing
It’s not only Hagrid’s three headed beast of Harry Potter fame that goes by the name Fluffy. Marketing has been “accused” of being ‘fluffy’. By which it is meant, that it is not measurable, not accountable and it is unclear how it impacts the business.
That may have been true once, and we have heard many non-marketers quote Lord Leverhulme, founder of Unilever:
“Half the money I spend on advertising is wasted, and the problem is I do not know which half.”
Things have changed…
In today’s digital age all your marketing should have a tangible impact on the bottom line and data is key to your success.
The following quote is far more apt:
“No great marketing decisions have ever been made on qualitative data”
John Scully 1939-, former president of Pepsi and CEO of Apple
Accountability
Marketing must be every bit as accountable as every other department. In a previous article we discussed how your marketing plan should be keyed into the wider business goals and how to produce measurable objectives.
Marketers should be able to tell you what they’re doing and why. They should be able to clearly show how their efforts are improving results for the business.
In this article, we’ll discuss marketing Key Performance Indicators (KPIs). We will let you know what you should measure and why. We will then show you how to create a marketing dashboard, giving a quick ready reckoner on where you are.
What does a dashboard look like?
Your dashboard can be as simple or as sophisticated as you like. We like to think of it like an aircraft’s instrument panel. A good dashboard will tell you about the health of your marketing, its trajectory and whether you are likely to arrive at where you want to be in once piece.

Many CRM or automation software packages contain the functionality to create something that is highly visual and provides an instant overview of the key parameters. If you don’t have marketing software, Excel will allow you to do something similar (see our free download for an example you can use).
The important thing is that the KPIs it visualises are reporting the results that are relevant to your business.
So, what should you measure?
Well that depends upon your business objectives.
The chart below shows the results of a survey amongst SME owner managers and highlights three key categories:
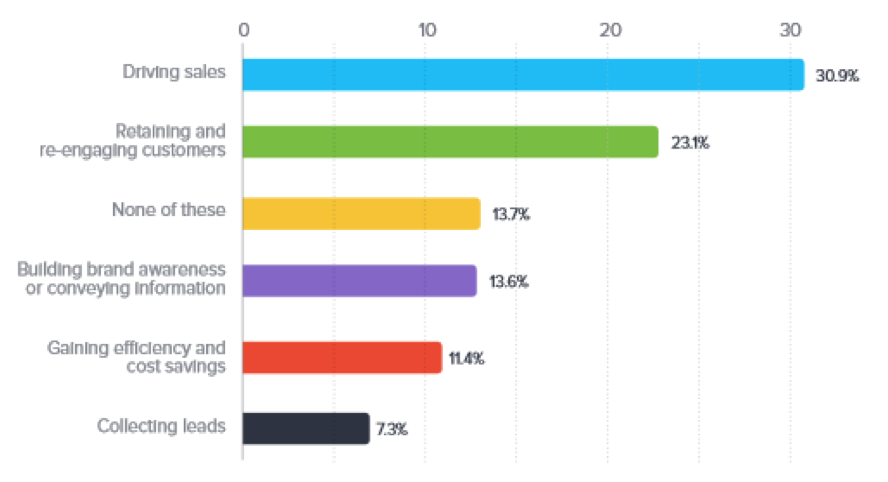
1. Driving Sales
The #1 objective for most businesses is to drive sales growth. If that is true for you then lead generation, cost per acquisition (CPA) and business development activity KPIs should take centre stage on your dashboard.
Metrics such as numbers of leads created, cost per lead, new clients / customers in the period and CPA are vital and will tell you a lot about your lead generation, lead conversion, and how much are you spending to secure a new customer.
Some businesses take this further and measure the upstream activity that generates the leads. They know that if the activity isn’t there, the leads won’t flow and downstream there will be a collapse in new client / customer wins!
If you are an eCommerce business, then your dashboard needs to show the number of visitors to your site, its ordering page and the number of people who check-out.
2. Client retention
For many businesses client retention rates are also key.
Your go-to-market model may depend on ongoing, retained monthly business from your client / customer base. If so, your marketing dashboard needs to tell you your client attrition rate and alert you at the earliest sign of problems.
If your business is more geared to discrete repeat purchases from loyal customers, then measure how many clients are coming back and the average client spend.
Client / customer engagement can be an important barometer; KPIs such as newsletter sign-ups are a good example of this. Some newsletter automation software will give you an engagement rating for each person on your mailing list.
3. Brand building / awareness generation
If your key marketing objective is brand building, then measure awareness KPIs such as:
- Unique website visits, returning web visitors etc.
- Social media likes and shares,
- Blogs readership, shares and commented upon
- Press mentions (online and offline)
Both Facebook and Google have an awareness measure. This is an estimate of the number of people reached that will recall your post.
But … Don’t focus only on the numbers
As well as the hard numbers, marketing should report on their monthly activities. It is important that they are accountable for what they said they’d do!
Return on Marketing Investment (ROMI)
Return on marketing investment is a way of measuring the business contribution attributable to marketing and can be calculated in many ways.
For example – Sales / Marketing ‘invested’ or risked.
ROMI can be measured in two ways:
- Short Term: a simple index measuring the £s of revenue for every £ of marketing spend.
- Long Term: It can be used to determine less tangible aspects of marketing effectiveness. For example; increased brand awareness
Summary
If you aren’t using KPIs to measure your marketing efforts then you don’t know if you are doing well. You don’t know what you need to improve. Or if the money you are spending is giving any benefit at all.
The metrics you select need to be appropriate to your business objectives. Summarising them in the form of a highly visual marketing dashboard is a great way of bringing accountability to a function that is vital to your business.